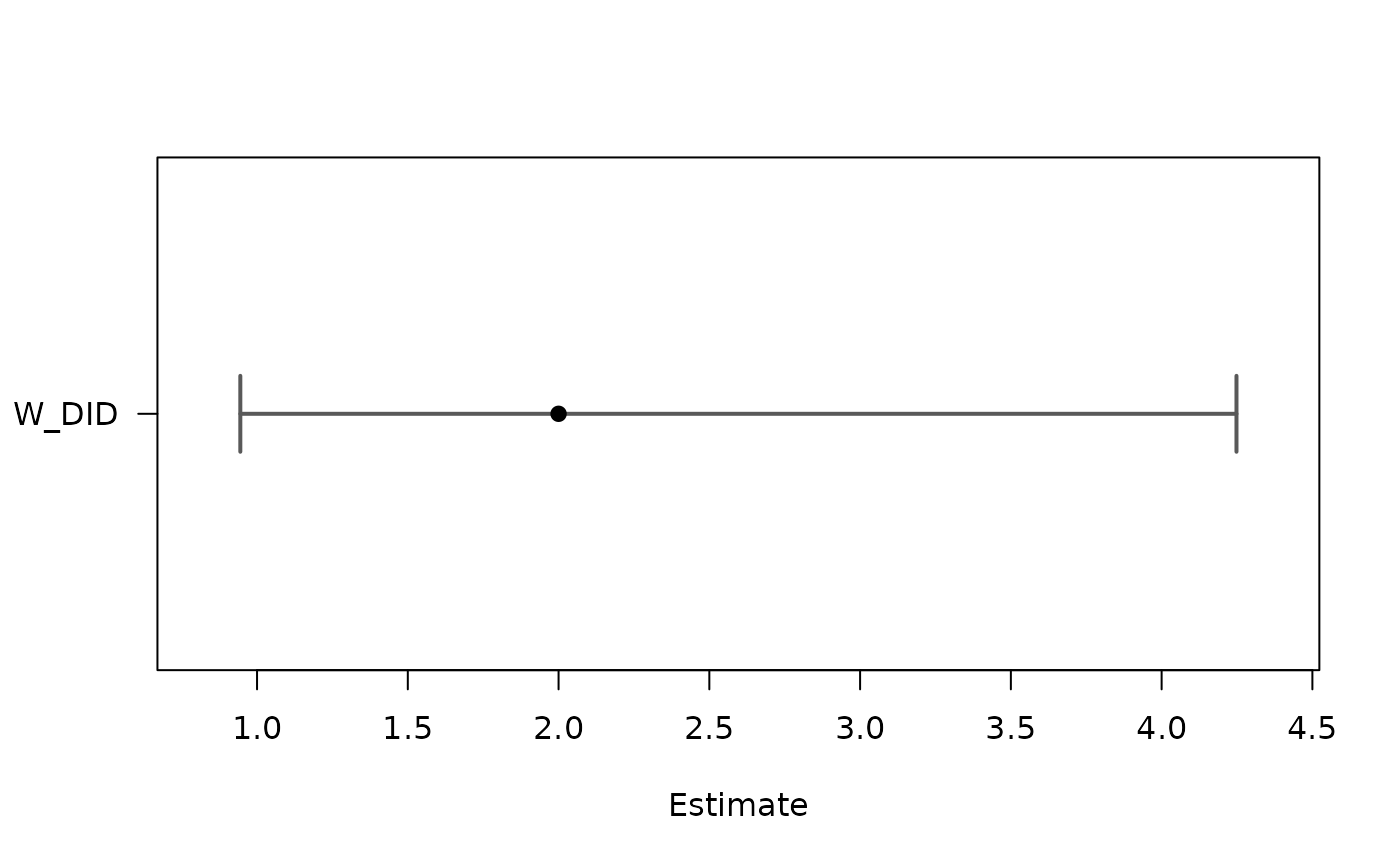
Plot fuzzydid point estimates and stored confidence intervals as a base R dot-and-whisker plot.
Usage
# S3 method for class 'fuzzydid'
plot(x, ...)Examples
df <- expand.grid(i = seq_len(20), g = 0:1, t = 0:1)
df$d <- as.integer(df$i <= c(4, 8, 6, 16)[1 + df$t + 2 * df$g])
df$y <- 1 + 0.5 * df$g + 0.4 * df$t + 2 * df$d + sin(df$i / 7)

fit <- fuzzydid(df, y ~ d, group = "g", time = "t", did = TRUE,
                breps = 5, seed = 1)
plot(fit)